T4K3.news
Trump misstates Washington homicide rate
A fact check shows the claim relies on outdated data and ignores important context.

This analysis shows that Trump’s claim about D C homicide rates relies on old data and lacks necessary context.
Trump misstates Washington homicide rate
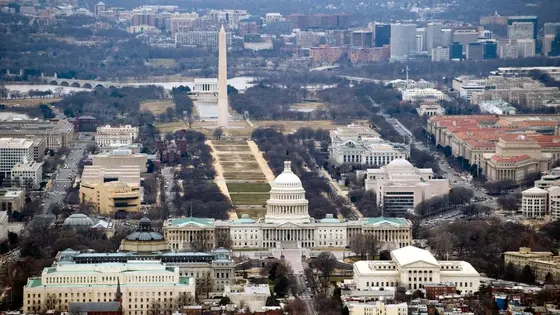
Trump claimed Washington, D C has the highest homicide rate in the world, supported by a chart he displayed during an Aug 11 press conference about a federal takeover of the district's Metropolitan Police Department. The data he cited come from 2023 and the rate was 39.4 per 100,000 at that time. Since then, Washington's rate has fallen, with 2024 data placing it at 27.3 per 100,000 and the Justice Department noting a 35 percent drop from 2023, marking a level not seen in more than three decades.
Experts caution that comparing D C to large international cities is flawed. Jeff Asher notes the data are from 2023 and come from a city with a different population size. James Alan Fox explains that including suburban areas in city limits can lower rates. The 2024 rate and 2023 numbers show D C is not the global top. The Igarapé Institute shows 49 cities had higher rates in 2023, including three capitals. The city limits shape the rate because crime statistics rely on the population base, and including suburban areas can moderate the rate.
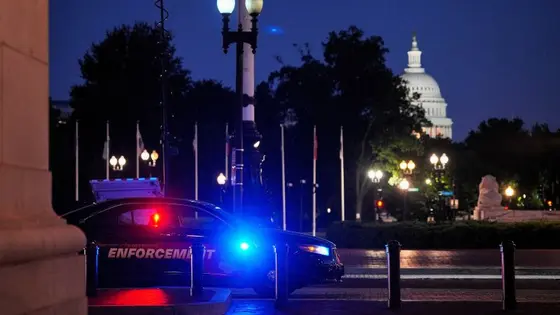
Beyond the numbers, this episode shows how crime data can be used in political theater. The move to deploy National Guard troops and to federalize the district’s police has raised questions about public safety and governance. The situation highlights the need for precise data labeling and responsible reporting to avoid misleading audiences.
Key Takeaways
"Context is the missing footnote in every chart"
A reminder that framing matters in data
"Data loves a dramatic headline not a careful story"
Critique of sensational use of numbers
"Numbers can mislead when the data behind them is old"
About relying on outdated data for current claims
"Facts deserve careful framing before they become headlines"
Advocating responsible data presentation
This episode reveals a broader pattern where statistics move quickly in political discourse and can be misused to justify policy actions. When a chart is treated as proof rather than a frame, nuance fades and public trust erodes. The lesson is simple: data must be current, properly scoped, and clearly caveated before it becomes a weapon in a political message.
The stakes extend beyond a single misquote. If audiences accept outdated numbers as reality, policy decisions—like shifting control of local police or deploying federal resources—can ride on shaky ground. A healthy media culture demands transparency about data sources, methodology, and what is being compared. That clarity helps the public evaluate both the numbers and the motives behind them.
Highlights
- Context is the missing footnote in every chart
- Data loves a dramatic headline not a careful story
- Facts deserve careful framing before they become headlines
- Numbers must carry context before they drive policy
Political sensitivity around DC crime data
The use of crime statistics in political arguments can shape public opinion and policy decisions, potentially provoking backlash and intense public reaction.
Data deserves careful handling whenever politics meets public safety.
Enjoyed this? Let your friends know!
Related News

Washington crime data under scrutiny

DC police under federal control

DC police takeover announced by Trump

Blue city mayors push back against Trump's plan to federalize DC police

Trump urges federal control of D.C. following crime incident

Homeless relocation plan in DC

Times Square shooting prompts debate on crime policy

Trump orders homeless eviction in Washington DC
