T4K3.news
Bristol crime map highlights reporting gains and safety questions
New Home Office figures place Bristol among the higher crime areas in the South West, shaped by improved crime recording and reporting practices.

A Home Office map puts Bristol among the top crime areas in the region as police data shows how recording practices influence the numbers.
Bristol tops South West crime map with one in eight victims
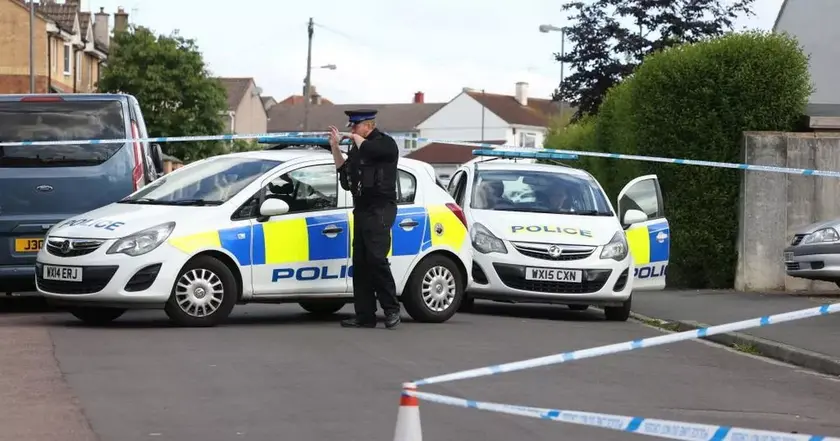
Bristol has the highest crime rate in the South West according to Home Office figures for the year ending March 2025. The city recorded 63,378 non-fraud crimes, a rate of 132 offences per 1,000 people, while the national total for England and Wales stood at more than 5.3 million, down 2% from the year before.
Avon and Somerset Constabulary says the rise in Bristol's recorded crimes largely reflects improved reporting, including more incidents of shop theft and reporting of previously under-reported offences. A 2022 HMICFRS inspection found under-recording in the force, which has driven reforms and a Crime Recording Standards unit to ensure data supports decision making and resource deployment. The map uses crimes per 1,000 people to compare places fairly and shows wide variation within the Avon and Somerset area.
Key Takeaways
"Encouraging people to tell us about under-reported crimes, such as rape, and a surge in shop theft reports are factors in the rise in recorded crime."
Policy officials noting why counts have risen.
"Since 2022 Avon and Somerset Police have been working to improve crime recording, following an inspection by HMICFRS."
Official acknowledgment of reforms.
"Improved crime recording has increased reported numbers to guide decisions and resource deployment."
Impact of data quality on policy.
"Data must be read with care and context to protect communities."
Editorial caution about interpretation.
Numbers can mislead as easily as they inform. A high rate in Bristol may reflect more complete counting rather than more crime per person, and that distinction matters for residents who want safety, not just statistics.
Policymakers should use data to drive prevention, not fright. The map invites scrutiny of how resources are allocated across the region and how we talk about safety in public life.
Highlights
- Better reporting changes the crime numbers, not the streets.
- Read the map with care, context matters.
- Data informs action when it is understood, not when it alarms.
- Numbers rise when counting improves, not when safety worsens.
Potential public reaction risk in Bristol crime reporting
The Bristol figures could spark public concern and political debate if perceived as a sudden rise in danger. Readers should be guided to understand that recording improvements, not just crime spikes, drive the numbers.
Context matters when reading crime data; it should guide safer communities.
Enjoyed this? Let your friends know!
Related News

Merseyside jails 66 criminals in July

Trump moves to seize DC police control

DC police takeover faces federal lawsuit

Israeli Forces Face Allegations of War Crimes

Capitol presence links Trump pick to January 6

Murder linked to cannabis highlights safety concerns

Delta co-pilot arrested on serious charges
Acid attacks surge in Northumbria region prompting policy response